
The Executive Dashboard
2 min
When you log in to the Service Desk Console as a Portfolio Manager, the system automatically displays the Portfolio dashboard. To see the Executive dashboard, select it from the My Dashboards drop-down list.
Use this dashboard to obtain the following information:
- Information for reporting on Project and Portfolio Overviews, Strategic Objectives, and Financial indicators.
- Open Risks and Open Issues, Open Escalated Risks by Type.
Key to symbols:
 | Refresh the data being shown by the dashboard pane. |
|---|---|
 | Export the chart to a .png image. |
 | Toggle the chart legend on or off. |
 | Maximize this chart pane to full screen. |
Parts of the Dashboard
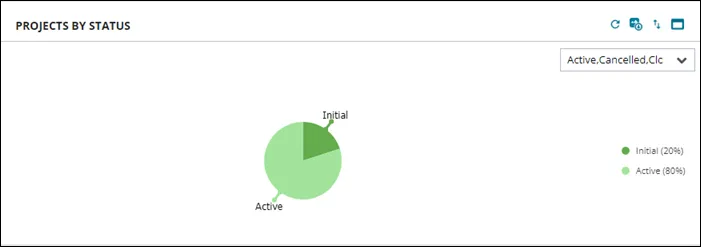 | PROJECTS BY STATUS
|
|---|---|
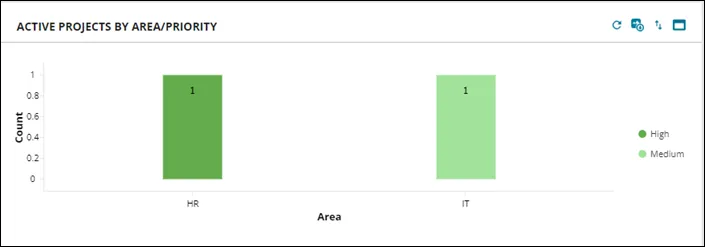 | ACTIVE PROJECTS BY AREA/PRIORITY
|
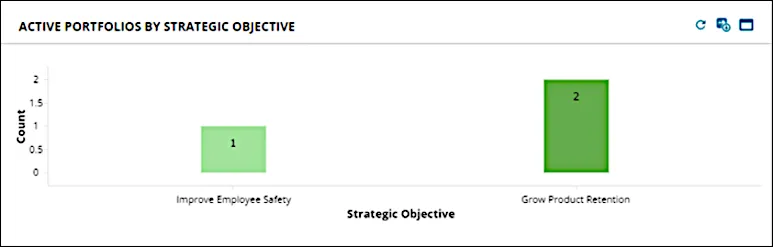 | ACTIVE PORTFOLIOS BY STRATEGIC OBJECTIVE
|
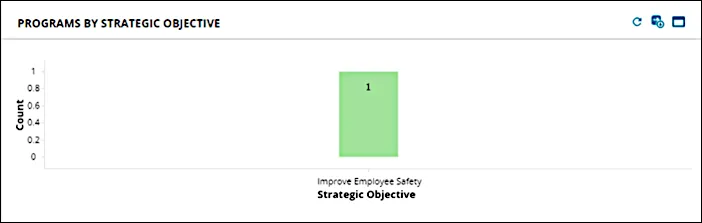 | PROGRAMS BY STRATEGIC OBJECTIVE
|
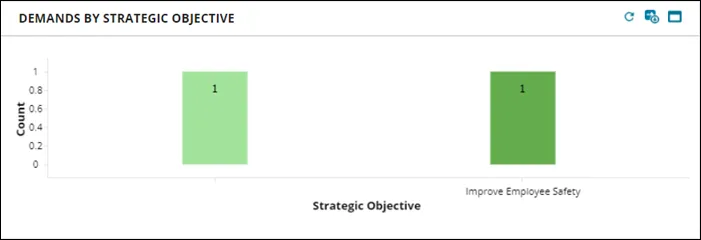 | DEMANDS BY STRATEGIC OBJECTIVE
|
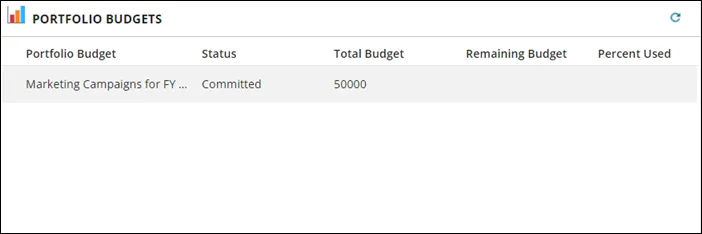 | PORTFOLIO BUDGETS
|
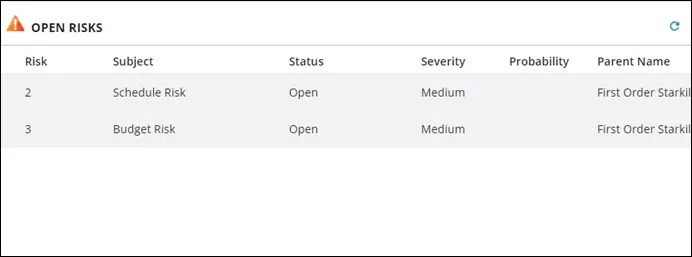 | OPEN RISKS
|
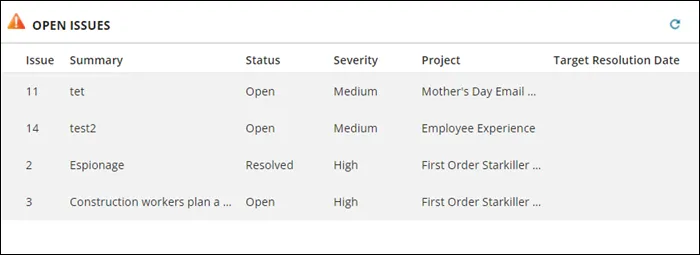 | OPEN ISSUES
|
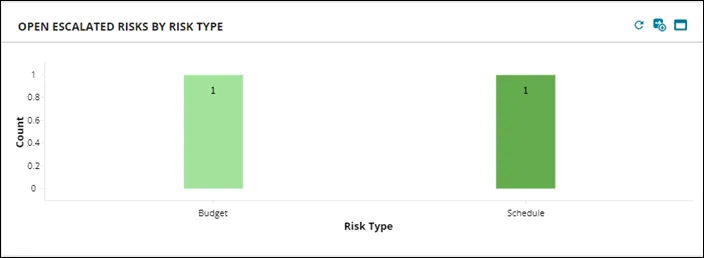 | OPEN ESCALATED RISKS BY RISK TYPE
|