
To create and generate a report
1 min
- In the left navigation pane, click Reports > Ad-hoc Reports. The Reports page displays.
- From the Select Actions drop-down, select New Report.
- Enter a name for the report.
- Select the Is Private option if the report should be visible to selected users only, then add those users.
- Select the Is Scheduled option if the report should be sent to users according to a specific time and date, then configure that schedule.
- In the left column, expand the required module heading to create the report.
- Click the properties of the module to be included in the report, then add any required conditions by clicking the icons.

- Drag and drop the selected properties into the given text box.
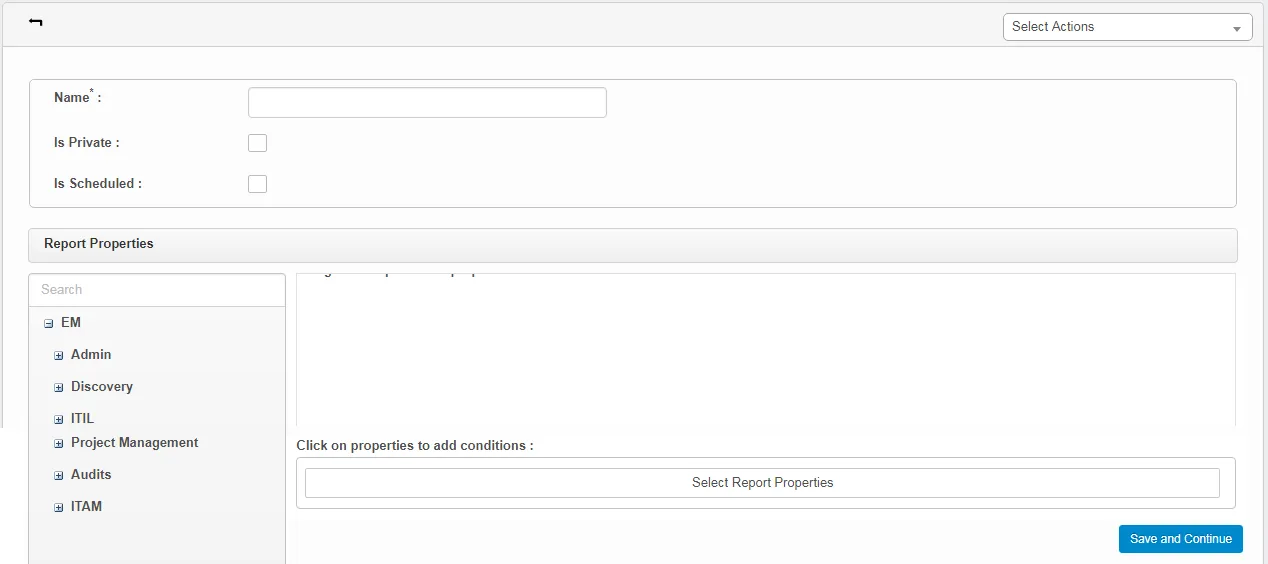

- Click Save and Continue.
- Click the Run Report tab to open the page where you can generate the report.
- From the Type drop-down, select the type of report to be generated. The available types of charts are tabular, bar, line, pie, and donut.
- From the Group by drop-down, select grouped properties to generate an incident report.
- Click Generate to view the report.
A sample report looks like this:
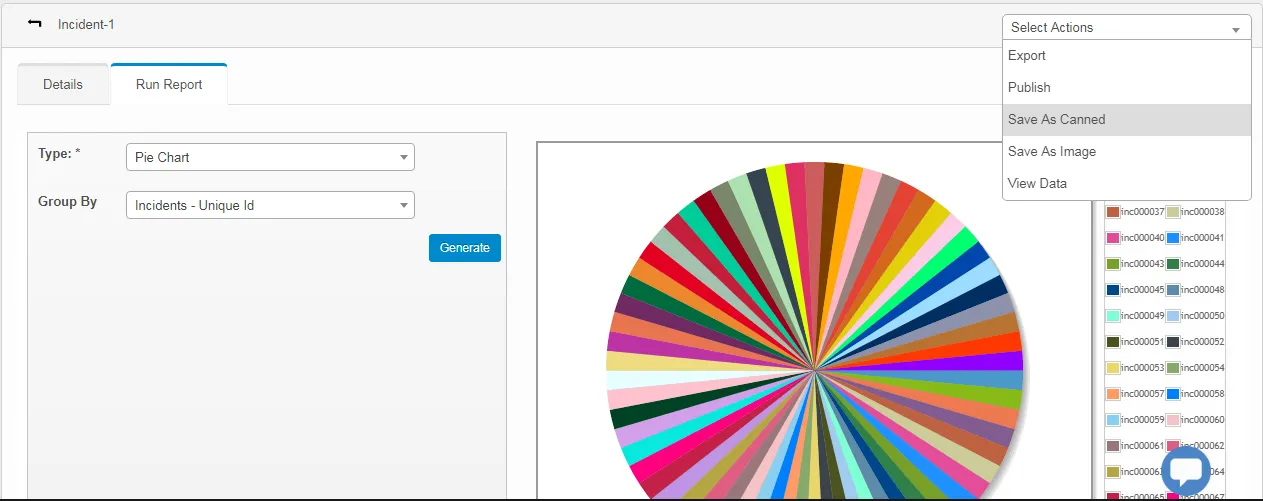
From the Select Actions drop-down on this page, you can do the following:
- Export: Export and view the report in Excel file format. An email with the attachment will be sent to the logged-in MSP vendor.
- Publish: Publish the report in the dashboard of the logged-in MSP vendor.
- Save as Canned: Save the report as a canned report with an automatically generated name.
- Save as Image: Save the report in an image format. Note that tabular reports can’t be saved as an image.
- View Data: View the data that has been accumulated for generating the report.