
Application Statistics
Purpose
Graphical displays of statistics show the distribution of accepted and denied requests according to the time and the individual handlers.
Each set of statistics refers to a specific application and to a specific ruleset (either protection ruleset or detection ruleset).
If the statistics function has been deactivated in the Global Configuration, there aren’t any application statistics data available.
Opening
- In the navigation area, select the application for which you want to open the statistics.
- Activate the Monitoring | Attack Analysis tab.
- Activate the Rulese drop-down list, select whether you want to see the statistics for the protection ruleset or for the detection ruleset (option only available when in protection mode).
- From the Handler drop-down list, select whether you want to see the Deny-Request Distribution for all requests or only for those requests that were denied by a specific handler.
- From the Time period drop-down list, select the period for which you want the data to be displayed.
- If you want to confine analysis to certain decider cluster slaves or hosts, click the arrow symbols next to the Time period list and select the desired nodes and hosts. To select multiple entries, click them one after the other.
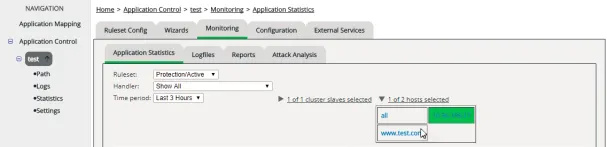
The application statistics view refreshes automatically.
Some of the diagrams, on the y-axis show the number of requests. Please note that the total number of requests depends on the chosen Time period. The longer this time period is, the more requests are sent to your web application on average. Therefore, you can’t directly compare the indicated values for different time periods.
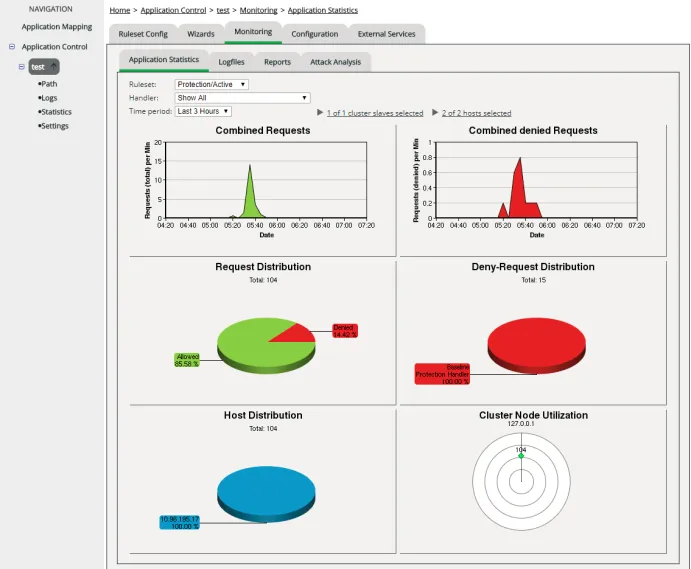
Information displayed
Diagram | Meaning |
|---|---|
Combined Requests | Distribution of all requests (accepted + denied) across the selected period of time for all hosts of the application. |
Combined Denied Requests | Distribution of the denied requests across the selected period of time for all hosts of the application. |
Request Distribution | Percentage distribution of the accepted requests in comparison to the denied requests. |
Deny-Request Distribution | It depends on the selection made within the Handler selection list what's shown here:
|
Host Distribution | Percentage distribution of all requests, relating to the individual hosts of the application. |
Cluster Node Utilization | Number of requests, relating to cluster nodes. |