
TCP Dump
This is a tool to sniff the packet, when you want to examine that the expected packet really reached a node. You can run the tcpdump utility to sniff the packet headers on the network and save them on a dump file.
To use tcpdump:
- Select Maintenance > Troubleshooting > TCP Dump to display the configuration page.
- Complete the configuration as described below.
- Click Start Sniffing to start the tcpdump process.
- Initiate the action you want to debug, such as a user sign in.
- Click Stop Sniffing to write the tcpdump output to the screen.
- Click Get to save the output to a file, or click Delete to clear the output.
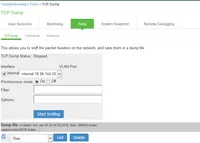
Settings | Guidelines | |
|---|---|---|
TCP Dump Status | Displays whether the utility is stopped or running. | |
Interface | Select the ports on which to sniff. | |
VLAN Port | Select the VLAN port. | |
Promiscuous mode | Select a promiscuous mode option. | |
Filter | Specify a filter expression. For information about TCP dump filter expressions, see the UNIX man page. | |
| Example | Result |
| tcp port 80 | Sniffs packets on TCP port 80. |
| port 80 | Sniffs packets on TCP or UDP port 80. |
| ip | Sniffs the IP protocol. |
| tcp | Sniffs the TCP protocol. |
| dst #.#.#.# | Sniffs the destination IP address specified, where #.#.#.# is a valid IP address. |
| src #.#.#.# | Sniffs the source IP address specified, where #.#.#.# is a valid IP address. |
| port 80 or port 443 | Sniffs on port 80 or port 443. |
| src #.#.#.# and dst #.#.#.# | Sniffs the source and destination IP addresses or hosts specified, where each #.#.#.# represents a valid IP address. |
| tcp port 80 or port 443 and dst #.#.#.# and src #.#.#.# | This example shows how to specify multiple parameters to create a filter that sniffs on TCP port 80, or on TCP or UDP port 443, and on the destination and source ports, where each #.#.#.# represents a valid IP address. |